| Aim:
To explain the use of X-rays in medical diagnoses. |
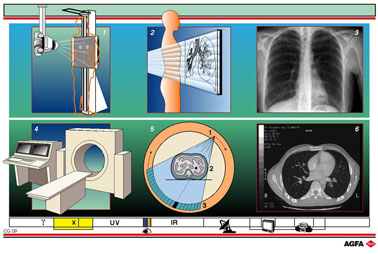
Diagram 1
shows a representation of an X-ray tube that is pointed at the total surface
area of a lung wall-stand. In this stand there can be a radiation-grid
that absorbs the deflected radiation, and a system to record the
X-ray image. X-rays are electromagnetic radiation.
In diagram 2 the patient, as already sketched in diagram 1, is clearly
shown in the X-ray bundle. The results of the absorbed and transmitted
radiation are also shown.
Diagram 3 shows such a thorax-(lung) exposure. This can be visualised
in a number of ways. The first is on
X-ray film.
To achieve this an X-ray cassette is placed on the stand. This cassette
must contain an unexposed X-ray film that is sandwiched between two intensifying
screens. After exposure the film contains a latent image from the thorax
exposure.
During the development process that follows, the image is developed, fixed,
rinsed and dried. The film is then ready for evaluation.
The second way makes use of a double conversion of this (analogue) X-ray
image. First it is converted from analogue to digital and then, in a second
step, from digital back to analogue. This can again be done in two ways.
A. Phosphor technology
In this technique a cassette is again used. However instead of the X-ray
film and intensifying-screen-pair, the cassette contains a screen which
has the property of being able to retain a latent image until, when energy
is supplied, it is released in digital form. This type of screen is mostly
constructed of so called X-ray phosphors based on rare earth metals, but
other compounds (based on Se and Si) can also be used. Once the image
is in its digital form it is possible to convert it to an analogue version
in a number of ways.
B.
Digital radiology
In this process conversion from analogue to digital form takes place immediately
in the thorax stand. The information is then transmitted electronically
so that a readable analogue image can again be obtained. This conversion
can be performed on a monitor or via a laser printer on laser film.
The available digital information can be transmitted via a network to
work stations, archive stations, viewing stations or via satellite connections
around the whole world!
Diagram 4 shows a CT scanner. This stands for Computerised Tomography
and the apparatus consists of an operating console with a powerful computer,
a mobile table and a gantry with a circular opening into which the patient
is transported. The gantry contains the X-ray tube and the detectors.
The X-ray beam is collimated according to the size of the detector. The
smaller the detector, and the greater the number of detectors, the smaller
and thus finer are the information points, the pixels.
Diagram 5: the X-ray tube, linked to the detectors on the other side,
turns in the gantry and exposes a narrow cross section of the patient’s
body. This process is then repeated after the patient has been moved along
by say 2 cm. The patient is, in this way, X-rayed in slices.
Diagram 6: the detectors convert the captured image-elements into digital
information; using a calculation procedure (algorithm) the computer generates
an analogue image of the cross section that is then displayed on a monitor.
This reconstruction can be made both in the cross-sectional plane, i.e.
transaxial (see Illustration Diagram 2) and also sagittal or coronal.
This analogue image can be manipulated:
contrast and light intensity values are frequently varied.
The patient’s details and a density-step-wedge are included in the
final image.
The line underneath shows visually the wavelengths with their areas of
application, from high to low frequency.
From left to right: the gamma-ray region, the X-rays, the ultra violet
region, the visible light region from blue to red, the infra red region,
the radar wave lengths, the TV region and radio waves.