M15 2s-orbital
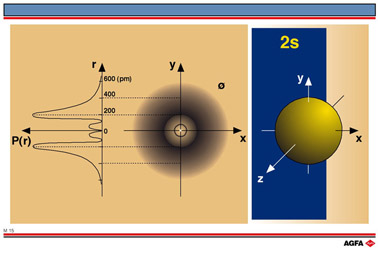
Aim: To show the spatial probability distribution of the 2s-orbital |
The curve shows two points where the probability of finding an electron is high; one close to the nucleus, one further away.
Illustration M15 shows in the centre diagram a crosssection of the electron density cloud, with two areas of high electron density corresponding with the maxima in the radial probability diagram.
The diagram on the right of illustration M15 shows the shape of a 2s-orbital corresponding to the boundary surface enclosing the volume in which there is a 90% chance of finding an electron.