M09 - M10 Emission spectrum and electron structure
Aim: To explain the relationship between the emission spectrum and the electronic structure of an atom |
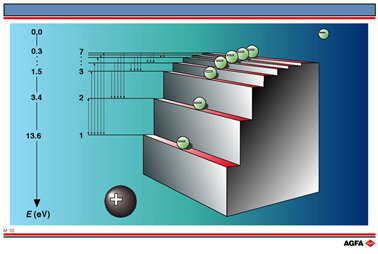
Every chemical
element has a unique emission spectrum which is determined by its electronic
structure. Every line in the spectrum is caused by an electron transfer;
an electron transition from a higher energy level or excited state to
a lower energy level. The excess energy (the difference between the two
levels) is released as a photon of light of a specific frequency, which
is seen as a line on the spectrum.
In 1885 the Swiss physicist, Balmer, succeeded in describing the visible
line spectrum of hydrogen as a function of the wavelength, ![]() :
:
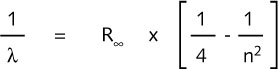
where ![]() is the Rydberg constant. By giving n the values 3, 4, 5, 6, ….. ,
the wavelength of every spectral line is described. The integer n is called
the principle quantum number.
is the Rydberg constant. By giving n the values 3, 4, 5, 6, ….. ,
the wavelength of every spectral line is described. The integer n is called
the principle quantum number.
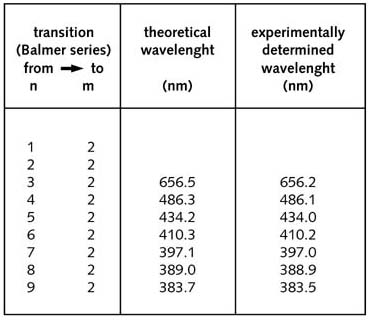
The table
below gives the calculated and experimental values for the Balmer-line
wavelengths (for H) using
![]() =
109677.6 cm-1.
=
109677.6 cm-1.
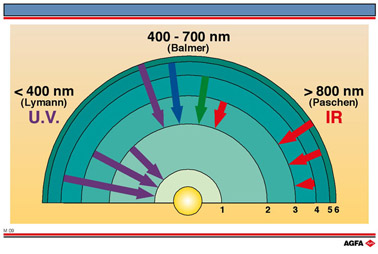
The infrared and ultraviolet spectral lines of hydrogen can be calculated in a similar
way, using the more general formula:
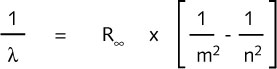
where m and n are both integers, of which n is the larger.
For m=1 the Lyman (ultraviolet) series is obtained. m=2 gives the Balmen (visible) series
discussed above and m=3 gives the Paschen (infrared) series.